(click for a larger image)
Software-processing
Both the resistivity and the magnetometry equipment come with the manufacturers download software.The resistivity software is suitable for both downloading data and processing but we tend to use TerraSurveyor and Snuffler to process our raw data.
| There is a danger with all sophisticated image processing programmes that over manipulation may induce artefacts in the images. We therefore aim to minimise the data manipulation. But at the very least you do need to process data to eliminate spikes and the effect of background 'noise' because the range of useful data may be very narrow and influenced by background effects such as a change in geological condition across a surveyed area. |
|
|
(click for a larger image) |
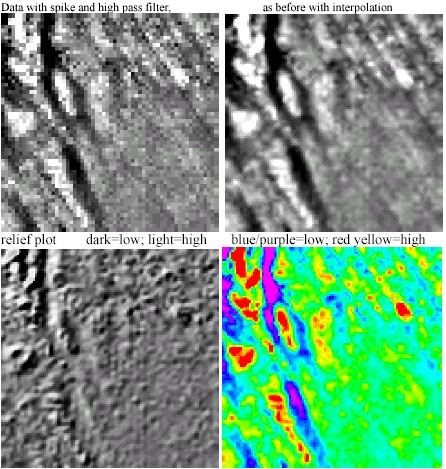
You also need to be able to match up surveys done at different times when the overall values recorded may be in a different range. To some extent this is a 'try and see the effect' process whilst bearing in mind that the further you get from the original values, the less relevant the results are to the real world. Sometimes manipulation does help in understanding what you can see. This image shows four different ways of presenting the same data. The bottom left quadrant shows a relief plot where the software creates a shadow effect dependant on an adjustable, theoretical height and position of the sun. |
Generally we filter out spikes, equalise mean values between
grids and apply corrections where necessary to minimise gross noise. This usually
takes the form of a high and/or low pass filter adjusted to the size of the
suggested features.
In magnetometry most of the useful data lies between +5nT and -5nT. In resistivity
the absolute range is largely irrelevant.
| Having produced an image which shows or suggests a feature, it is then often useful to relate that to old maps, aerial photographs or physical site surveys. We use MapMaker Pro to scale and superimpose these other images. | 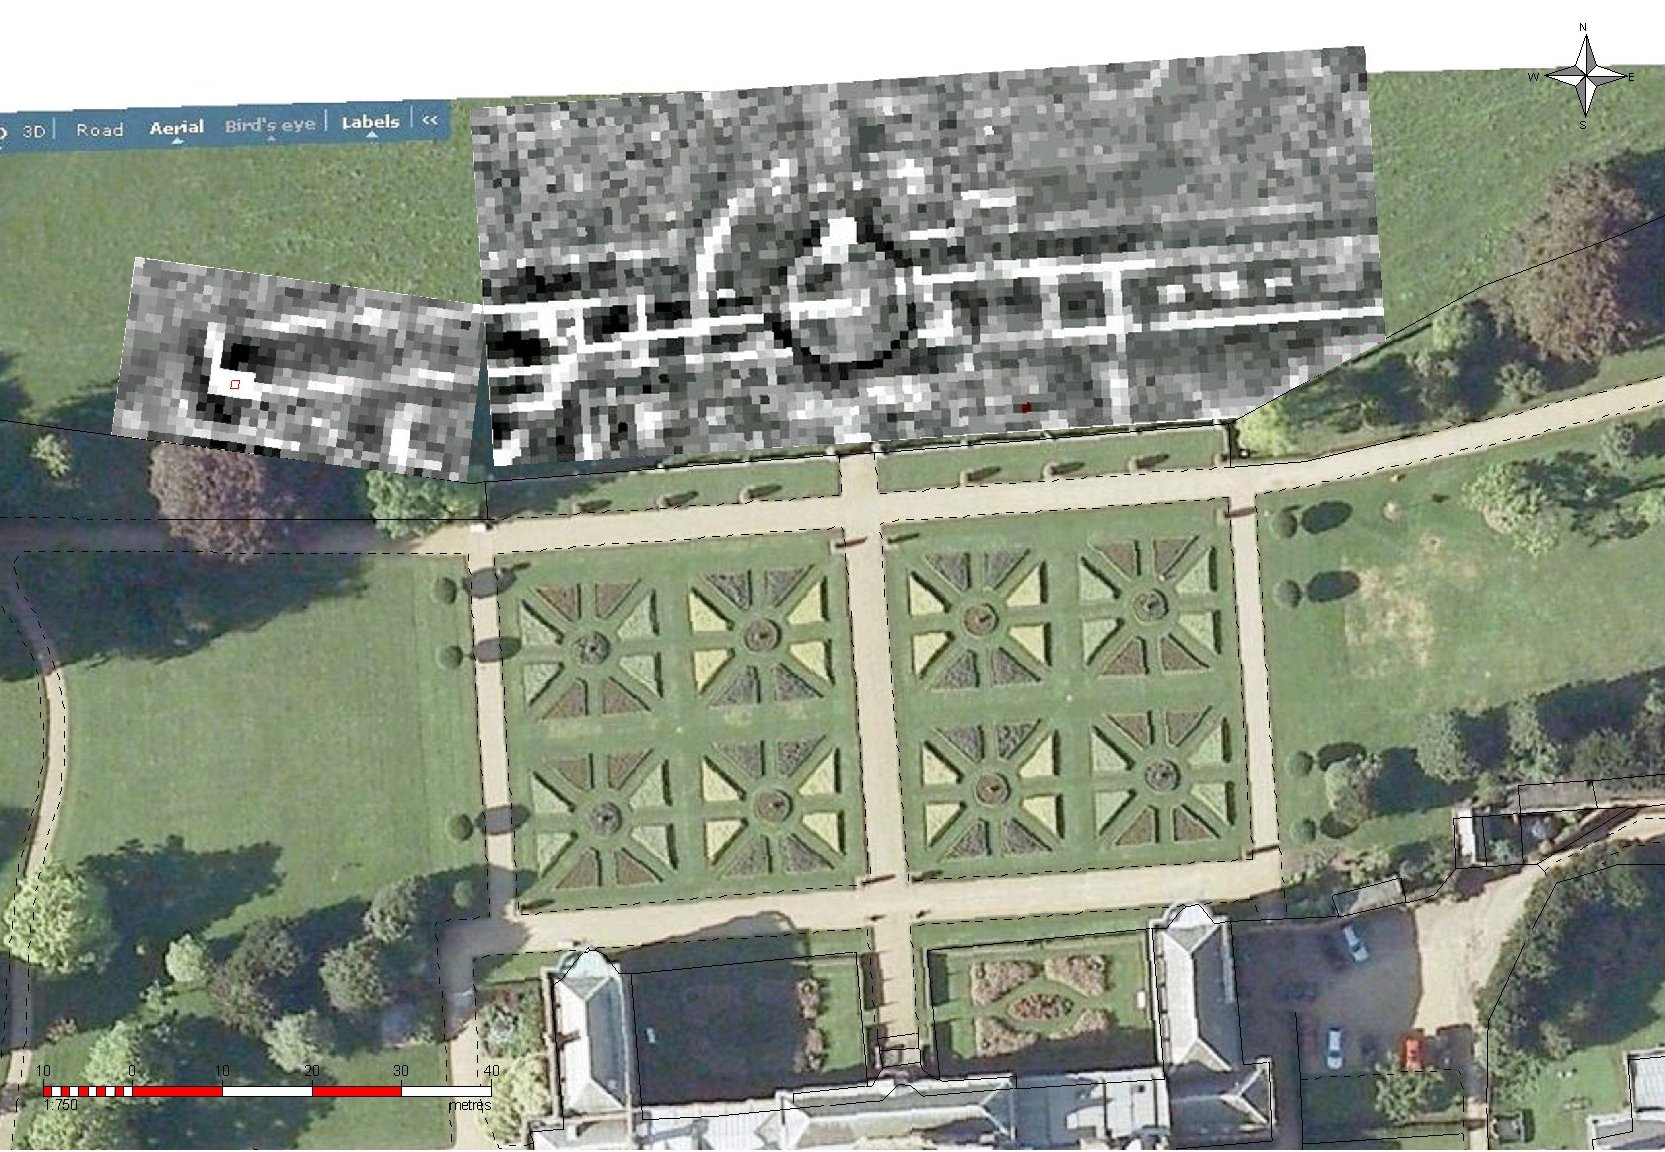 |
Scanned maps or physical surveys sometimes present a problem with pixellated blocks. This can be helped by converting the scanned raster image into a vector image. This is far from a perfect process, but it sometimes has it's place. We have found WinTopo to be very useful in this process.
Snuffler and the basic versions of Mapmaker and WinTopo all were free when I last checked. They are all excellent, and I have found them easy to learn and use. ArcheoSurveyor (now TerraSurveyor) you have to pay for after a free trial period, but it is easy to use, rich in features and in my experience has had brilliant customer support. QGIS is an open source mapping/plotting program which is pretty good. I've only got limited experience with it, but it is brilliant at taking lidar .asc files and generating a vector contour plot. The biggest problem by far with this is finding the right dataset on the opengov website.